import matplotlib.pyplot as plt
import numpy as np
import torch

import bofire.strategies.api as strategies
from bofire.benchmarks.api import DTLZ2
from bofire.data_models.objectives import api as objectives_data_model
from bofire.data_models.strategies import api as strategies_data_modelMerging multiple objectives to a scalar target for single-target BO
Benchmark Problem
Only used for domain definition
bench = DTLZ2(dim=2, num_objectives=2)
experiments = bench.f(bench.domain.inputs.sample(10), return_complete=True)

domain = bench.domain
Change the objectives: Multiplication, only reasonable for objectives > 0
outputs = domain.outputs.get_by_objective()

outputs[0].objective = objectives_data_model.MaximizeObjective(w=1.0, bounds=(0.0, 5.0))
outputs[1].objective = objectives_data_model.MaximizeObjective(w=1.0, bounds=(0.0, 2.0))
# outputs[1].objective = objectives_data_model.MaximizeSigmoidObjective(w = 0.5, tp=2.5, steepness=3.)
Select Strategies
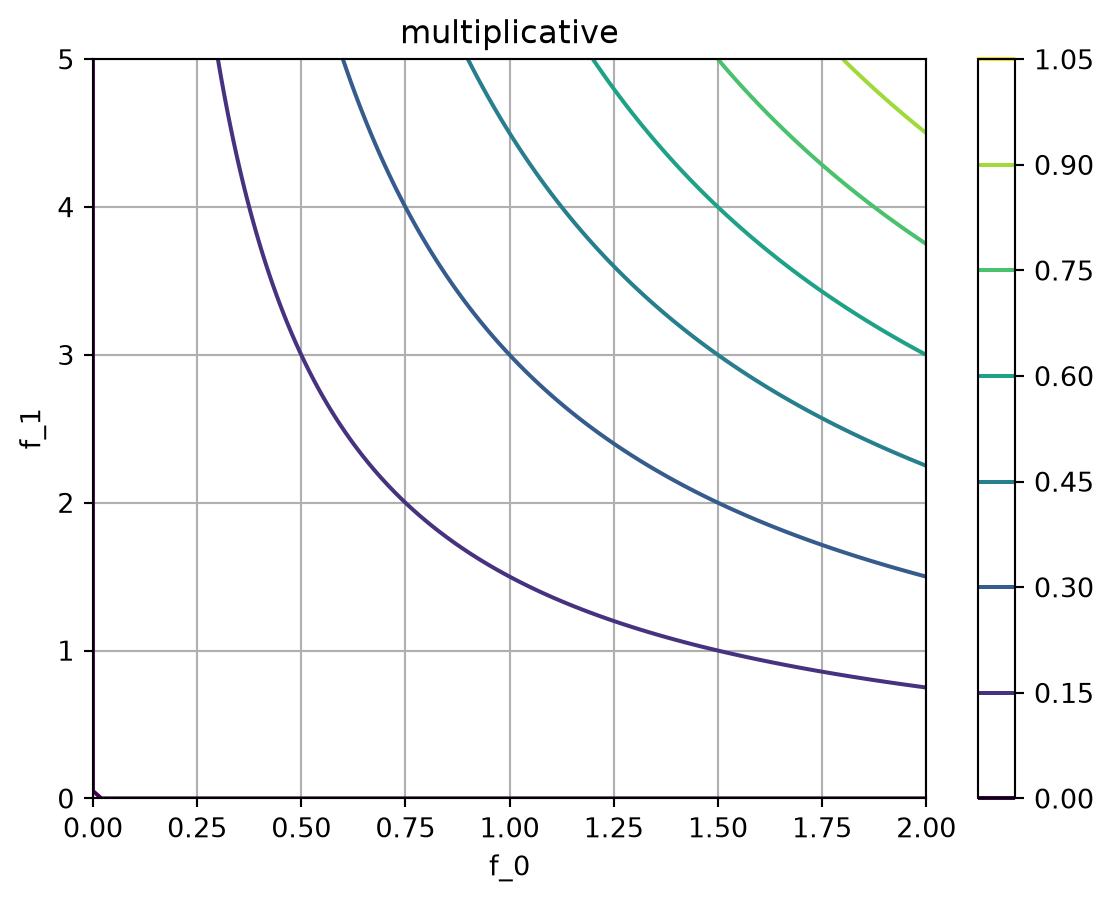
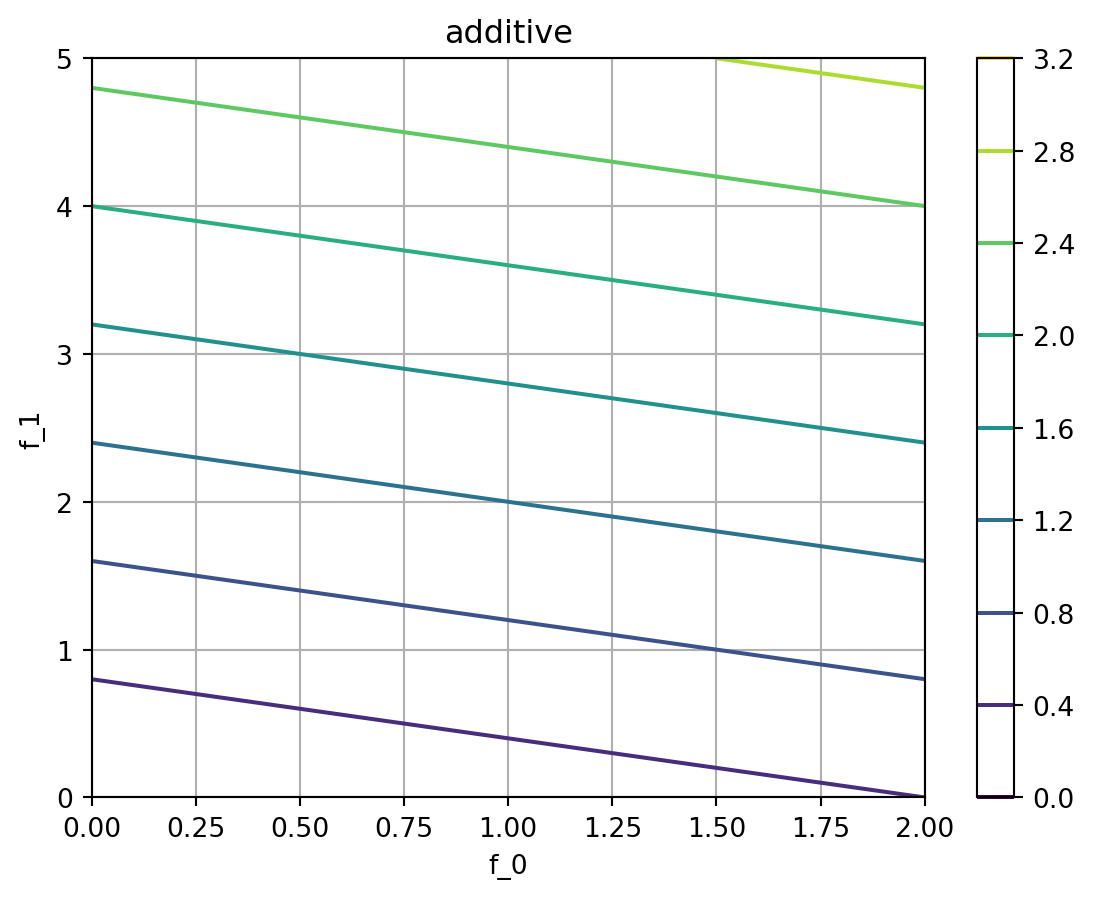
We will use pure multiplicative and additive Sobo strategies, as well as a mixed one for this example: - Multiplicative: \(f = f_0^{w_0} \cdot f_1^{w_1}\) - Additive: \(f = f_0 \cdot w_0 + f_1 \cdot w_1\) - Mixed (with f1 being the additive objective): \(f = f_0^{w_0} \cdot (1 + w_1 \cdot f_1)\)
strategy_data_model = {
    "multiplicative": strategies_data_model.MultiplicativeSoboStrategy(domain=domain),
    "additive": strategies_data_model.AdditiveSoboStrategy(domain=domain),
    "mixed": strategies_data_model.MultiplicativeAdditiveSoboStrategy(
        domain=domain, additive_features=["f_1"]
    ),
}
We will now create the strategies and evaluate them on a grid to visualize the objectives.
We see the following: - Multiplicative: The objective is a product of the objectives: If either \(f_0\) or \(f_1\) is low, the objective is low. - Additive: The objective is a sum of the objectives: We see a linear increase in the objective with increasing \(f_0\) and \(f_1\). This is useful for complementary objectives. - Mixed: The objective is more strict w.r.t. \(f_0\) than the additive objective \(f_1\). The overall desirability can also be high, if \(f_1\) is low.
Changing the weights \(w_i\) in the objectives above will further change the preference of \(f_0\) and \(f_1\).
# map from the strategy data-model to the actual strategy object instances
strategy = {
    key: strategies.map(strategy_data_model)
    for (key, strategy_data_model) in strategy_data_model.items()
}
# tell the strategies about the experiments. This is required to set up the models, but not for the objective evaluation
for _, strat in strategy.items():
strat.tell(experiments)/opt/hostedtoolcache/Python/3.12.13/x64/lib/python3.12/site-packages/bofire/surrogates/botorch.py:185: UserWarning: The given NumPy array is not writable, and PyTorch does not support non-writable tensors. This means writing to this tensor will result in undefined behavior. You may want to copy the array to protect its data or make it writable before converting it to a tensor. This type of warning will be suppressed for the rest of this program. (Triggered internally at /__w/pytorch/pytorch/torch/csrc/utils/tensor_numpy.cpp:213.)
torch.from_numpy(Y.values).to(**tkwargs),# get the objectives for evaluation as a torch executable
objectives = {
key: strategy._get_objective_and_constraints()[0]
for (key, strategy) in strategy.items()
}# f_0 / f_1 coordinates for objctive evaluation
mesh = np.meshgrid(np.linspace(0, 2, 100), np.linspace(0, 5, 100))
# transform to matrix-form torch tensor
mesh_tensor = torch.tensor([m.flatten() for m in mesh]).T/tmp/ipykernel_6243/1215888523.py:4: UserWarning: Creating a tensor from a list of numpy.ndarrays is extremely slow. Please consider converting the list to a single numpy.ndarray with numpy.array() before converting to a tensor. (Triggered internally at /__w/pytorch/pytorch/torch/csrc/utils/tensor_new.cpp:252.)
mesh_tensor = torch.tensor([m.flatten() for m in mesh]).T# evaluate objectives
objectives_eval = {
key: obj(mesh_tensor).detach().numpy().reshape(mesh[0].shape)
for (key, obj) in objectives.items()
}# plot the objectives as contour plots
for key, obj in objectives_eval.items():
plt.figure()
plt.contour(*mesh, obj, label=key)
plt.title(key)
plt.xlabel("f_0")
plt.ylabel("f_1")
plt.grid(True)
plt.colorbar()
plt.show()